

Adding Python to a report
From Analytics Chat
Ask for the analysis in natural language — “forecast next quarter’s revenue”, “find anomalies in signups” — and the agent runs Python for you, rendering the result inline in the chat thread. This result is ephemeral by default. Ask to save it to a workbook and Cube persists both the code and the run result onto a report, which then renders the saved output without re-running. Saving re-executes the analysis.The agent reaches for Python only when the answer genuinely needs a statistics
or machine-learning library. Ordinary aggregations, top-N, ratios, running totals,
period-over-period comparisons, and time series all stay in SQL, because a Python
run costs a re-query plus a sandbox start. If you expected Python and got a plain
SQL report, that is usually correct behavior.
In a workbook
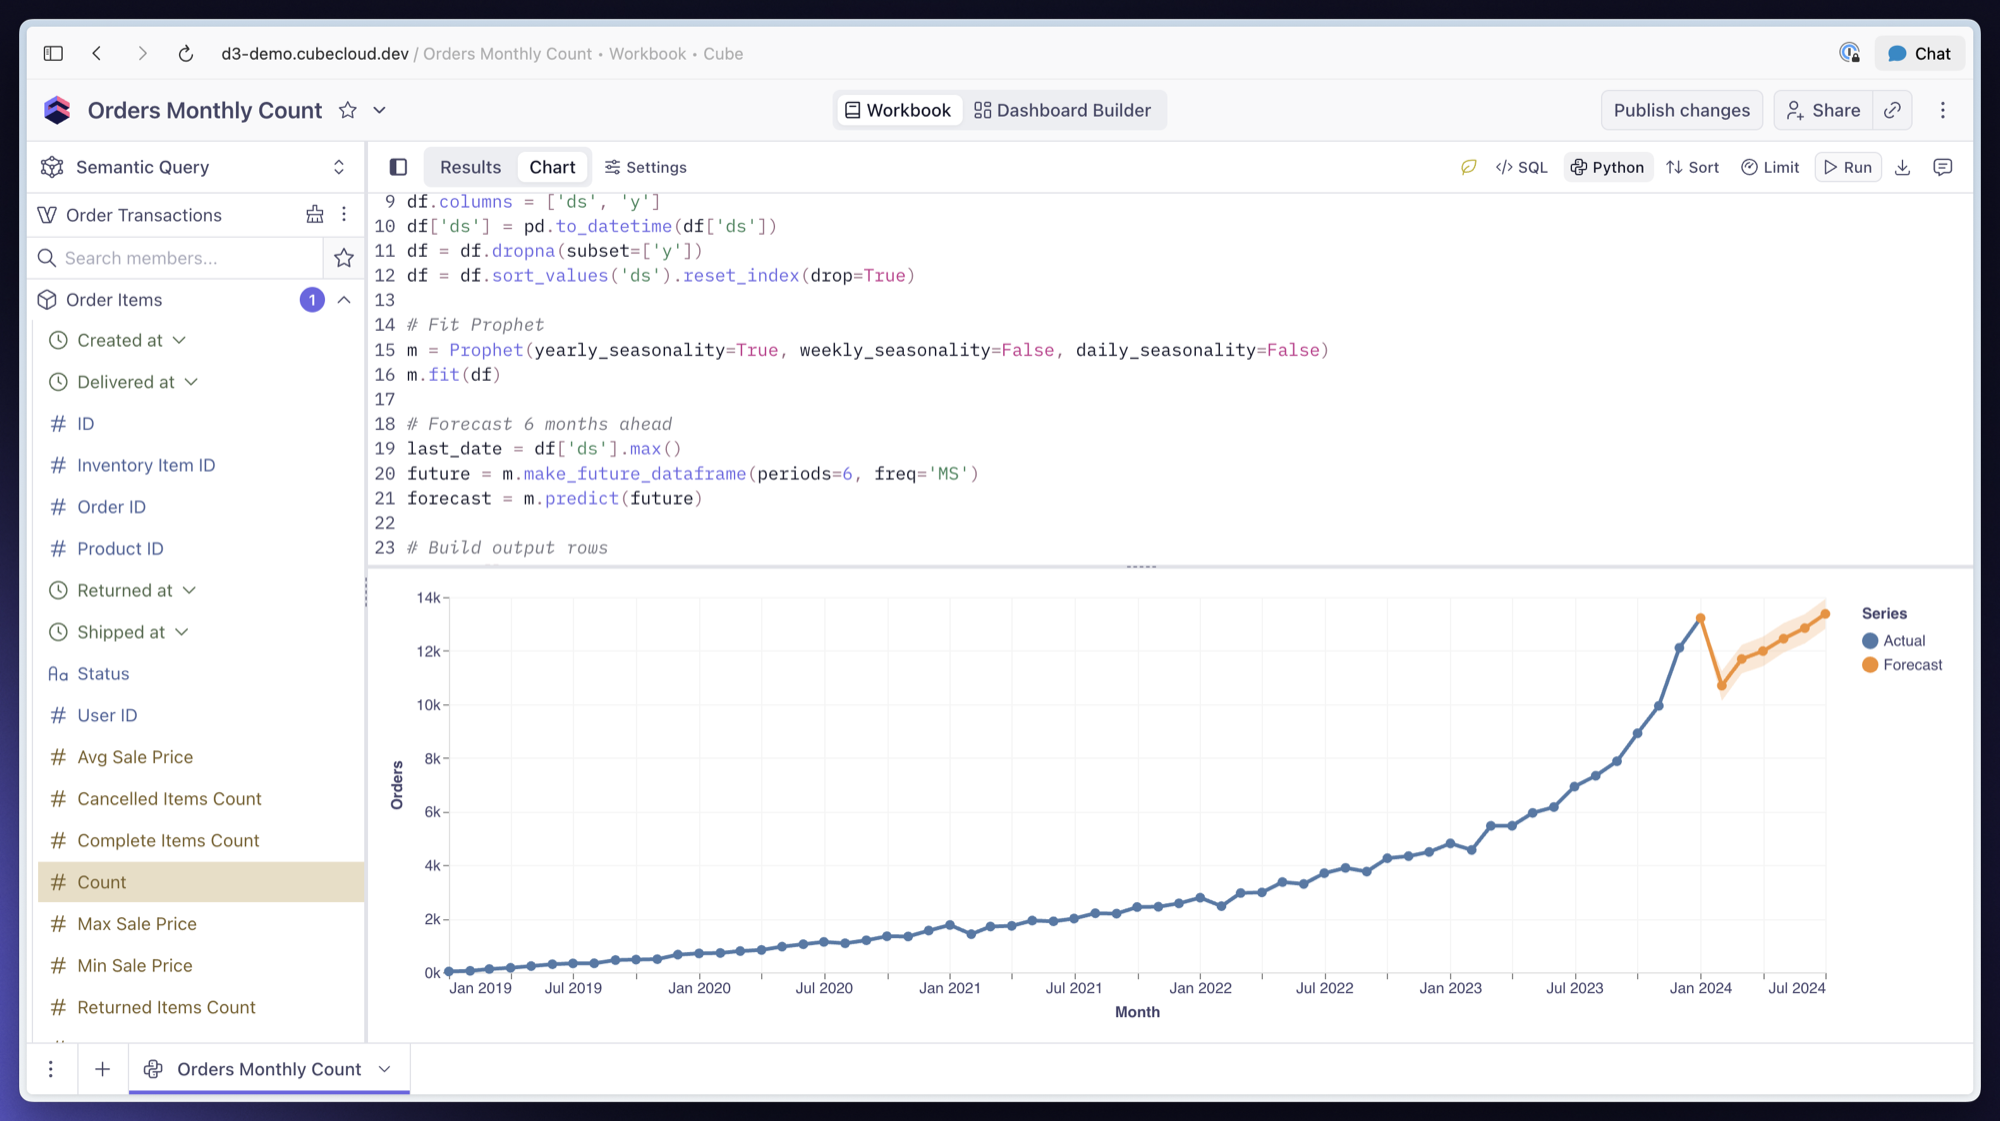
Open the tab menu and choose Add Python. Cube seeds a starter script and reveals the code panel. Remove Python detaches the script, after which the tab behaves like any SQL-backed report again. Attaching Python clears any existing SQL result: a python-backed report renders its last Python run, and a freshly attached script has none until you press Run.In Explore
Use the Add Python button in the header, with the same Remove Python counterpart. This is only available on a saved exploration. On an unsaved one the button is disabled with the tooltip “Save exploration before adding Python.” — Run executes server-persisted code, so the analysis needs a saved report to live on.Writing the script
The script runs in a sandbox against a fixed contract:- Input data arrives as
data.csvin the working directory. - Write results to
output.jsonas a flat JSON array of row objects, for example[{"month": "2026-01", "value": 1.5}, ...].
Running and refreshing
The code panel is editable in place, with line numbers.- Edits do not run anything. They save with the report, and the rendered result keeps showing the previous run.
- When the code or its input SQL has changed since the last run, the result is marked Outdated, with the tooltip “The Python code or its input SQL changed after the last run. Run to refresh the saved result.”
- Run executes the stored script in the sandbox and persists the refreshed result.
- The input SQL panel is read-only on a python report: that SQL is the sandbox’s input, not what gets charted.
- A failed run keeps the previous chart. The error and the script’s stdout/stderr surface in the UI while the last good result stays rendered.
On dashboards
Python reports render their saved output on dashboards. Nothing re-runs on dashboard load, so a dashboard full of Python reports costs no compute to open — each widget shows whatever the last Run produced. A python widget can be opened in Explore from a dashboard and run from there.Who the analysis runs as
Take this into account when deciding who can run and publish Python reports, the same way you would for any other saved result shared through a workbook.Limits
Exceeding the output caps means the analysis still returns in chat but cannot be
saved to a report. Aggregate or summarize inside the script so the output stays
within the caps — analysis results such as forecasts, cohorts, and test statistics
are small by nature.
Learn more
- Analytics Chat — the standalone conversational analytics experience
- Workbook Agent — the authoring assistant inside a workbook
- Source SQL tabs — query connected data sources directly